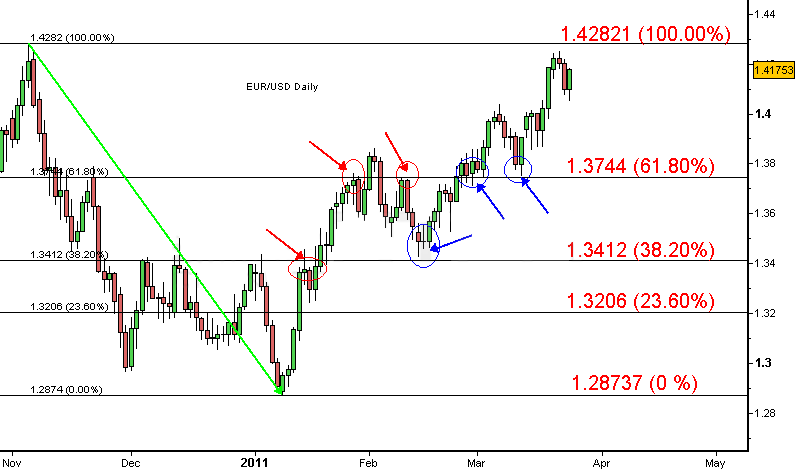
Trading indicators are mathematical calculations used to analyze price dynamics and trading volume on financial markets. They help traders make decisions about buying and selling assets, as well as determining stop-loss and take-profit levels.
The main principle of trading indicators is that they use past price data to forecast future market movements. These indicators can be used for various purposes, such as determining trend, identifying overbought or oversold conditions, identifying support and resistance levels, and many others.
Some of the most popular trading indicators include:
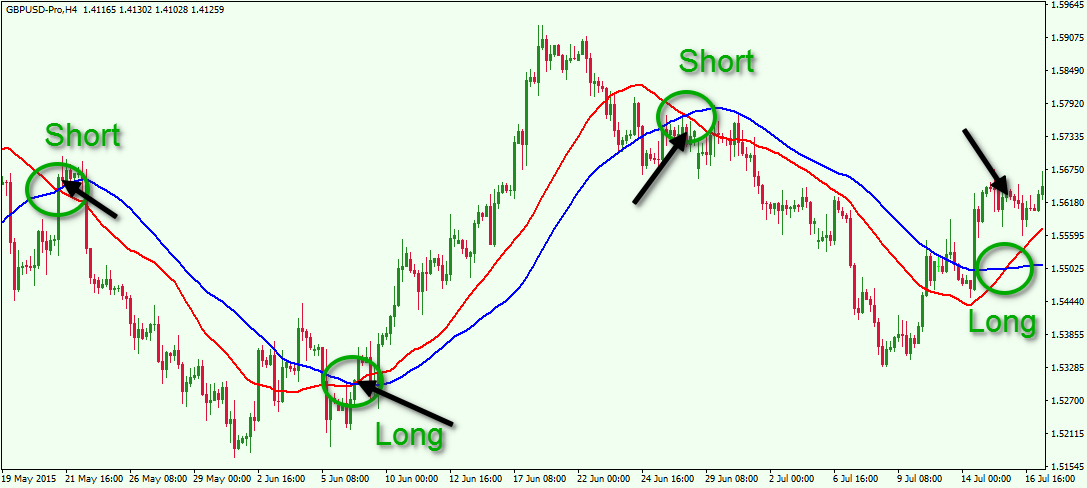
Moving averages: Moving averages is an indicator that shows the average price of an asset over a certain period of time. It is calculated by averaging the closing prices over a specific number of periods, such as the last 10 days. This indicator is used to determine the current direction of the trend in the market and can help traders make decisions about buying or selling assets.
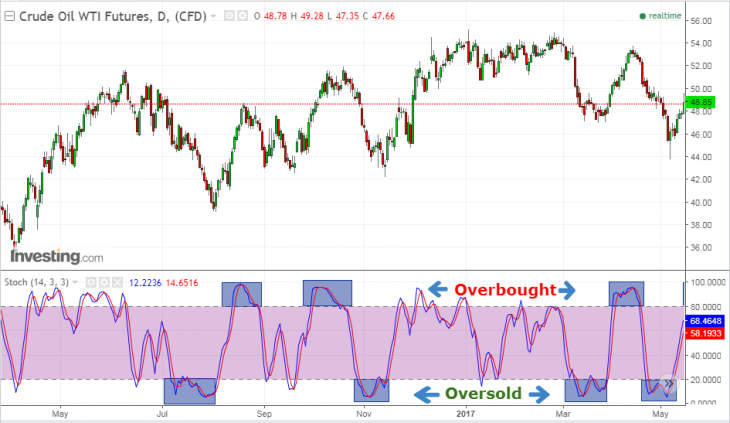
Stochastic oscillator: Stochastic oscillator is a technical indicator that shows the level of price variability of an asset. It displays the ratio of the current closing price to the price range over a certain period of time. The indicator allows to determine whether an asset is overbought or oversold, meaning whether the price is at its maximums or minimums. Stochastic oscillator can help traders make decisions about buying or selling assets depending on the level of overbought or oversold conditions.
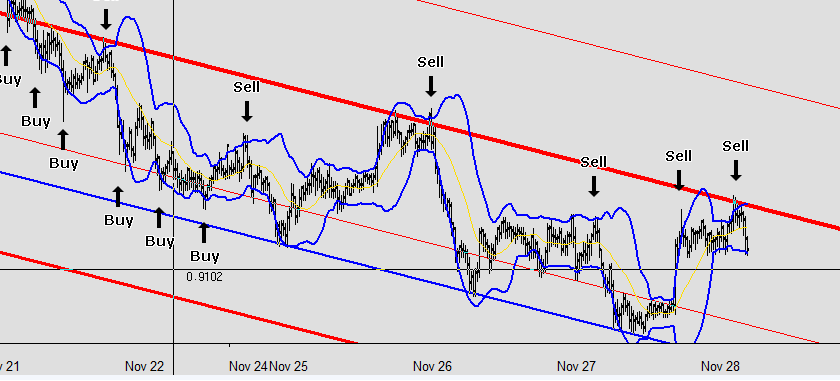
Bollinger Bands: Bollinger Bands is a technical indicator that shows the range of price fluctuations of an asset over a certain period of time. It consists of three lines: the middle line, upper band, and lower band. The middle line represents the moving average of prices over a certain period of time, while the upper and lower bands represent the standard deviation from the middle line.
Bollinger Bands can help traders determine when the price of an asset is outside the upper or lower band, indicating overbought or oversold conditions, respectively. When the price of an asset is outside the upper band, it may indicate overbought conditions, and vice versa, when the price is outside the lower band, it may indicate oversold conditions. These conditions can help traders make decisions about buying or selling assets.
Relative Strength Index (RSI) – This is a technical indicator used to measure the strength and speed of price changes in an asset. It measures the ratio of averaged price increases to averaged price decreases over a certain period of time and is expressed as a percentage from 0 to 100.
RSI can help traders determine if an asset is overbought or oversold. If the RSI is above the 70 level, it may indicate an overbought asset, while an RSI below the 30 level may indicate an oversold asset. These conditions can help traders make decisions about buying or selling assets.

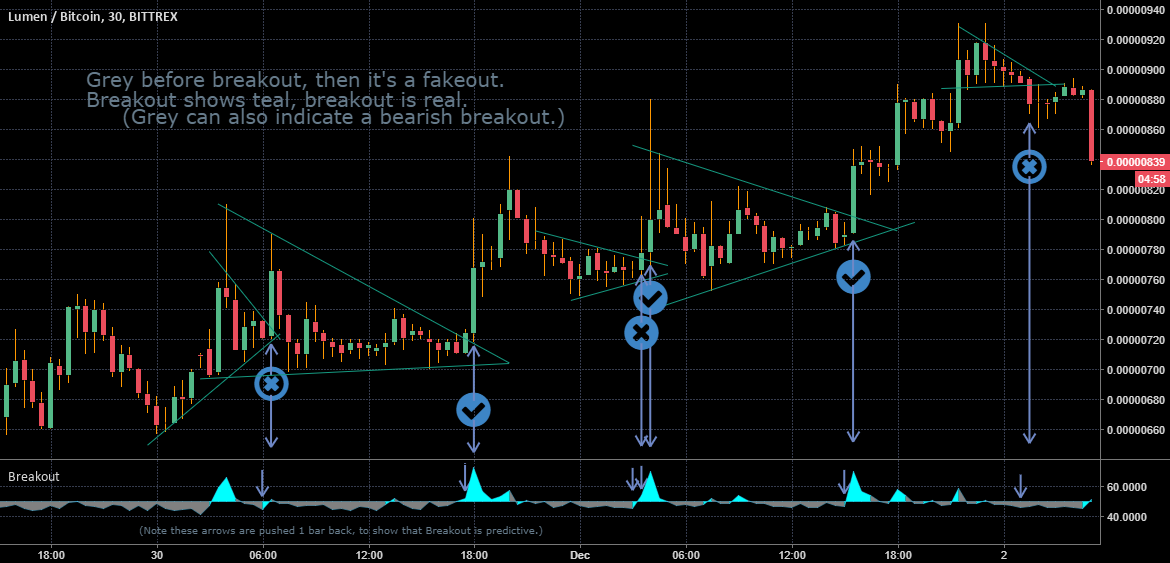
Breakout indicator – This is a technical indicator that is used to determine the moment when the price of an asset breaks out of its current price range and begins moving in a new direction.
The Breakout indicator can help traders identify potential entry and exit points in the market based on price breaks, as well as help determine support and resistance levels. When the price breaks through a established resistance level, it can indicate the start of an upward trend, and when the price breaks through a established support level, it can indicate the start of a downward trend.
Fibonacci – This is a technical indicator that traders use to determine support and resistance levels based on Fibonacci numbers. This indicator draws horizontal lines on the asset chart that correspond to support and resistance levels determined through the use of Fibonacci ratios of price changes.
Traders can use Fibonacci levels to identify potential entry and exit points in the market, as well as to set stop-loss levels and profit targets. For example, if the asset price reaches a Fibonacci support level, this may indicate a potential buy position, while if the price reaches a Fibonacci resistance level, this may indicate a potential sell position.
