Hello Traders!
Exciting times are coming in the world of cryptocurrencies! Today we will delve into the fascinating realm of Litecoin, a digital currency that has caused quite a stir. Join me as we review the trade idea I shared on 02/07/23 – an accurate prediction that accurately predicted the decline of this coin, all beautifully illustrated on a carefully crafted chart.
If you missed my groundbreaking LTC analysis, fear not! Staying up to date is critical in a rapidly changing trading environment. And guess what? The link below is a direct link to the latest news.
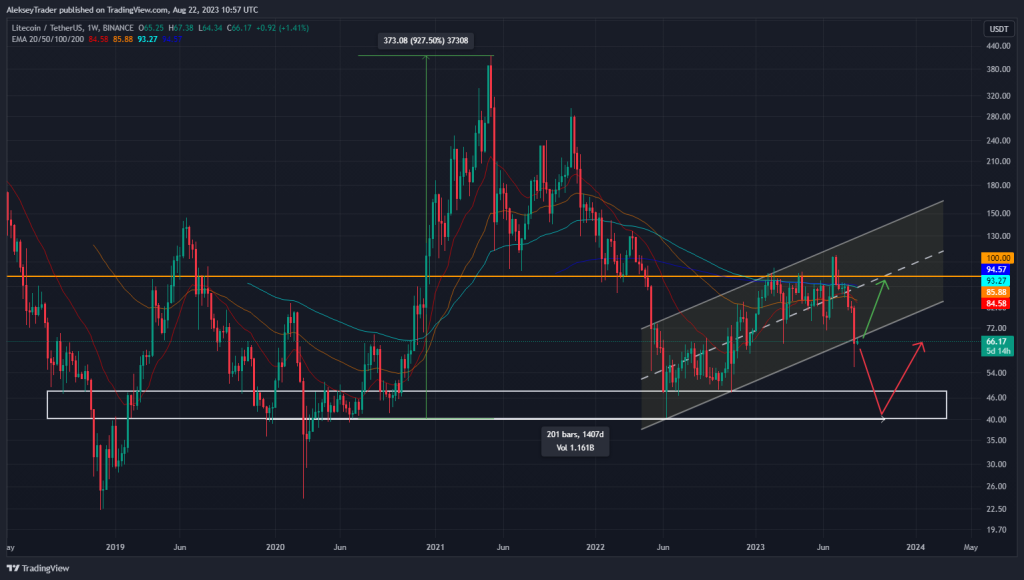
And a small reference to Scenario 1 from the previous review: we witnessed a drop in price as we attempted to break the upper channel line, which led to a retreat to the lower end of the channel, namely the $82-$75 zone. Our eagle eyes are riveted to this development. If Litecoin gracefully stays within the channel, we expect a potential jump towards the enticing $160-$170 range. But – and here’s the catch – if the price stumbles and falls below this lower support line, a downside path to the $67 territory and possibly even lower could be open.
LiteCoin Part 3:110$ the Limit or the Beginning of the Journey to $170?
Now let’s zoom in on the Litecoin chart. Our focus is on a sharp break below the lower support line of the local corridor. But hey, the excitement doesn’t end there. I have the bigger picture for you: a global stronghold of LTC support spanning the $40 to $47 range (delicately marked with a clean white tint). Since December 2019, this zone has been the guardian, preventing any drop below the $40 mark. Because it stands firm, it looks like a strategic fortress, promising an abundance of potential growth.
Against this backdrop, let’s delve into the exciting scenarios that could unfold in the coming weeks.
Imagine: the price returns to the channel, decisively approaching the coveted level of $100 (highlighted in a bright shade of orange). Why obsessed with $100? It’s not just another number; it is a stronghold of resistance. Looking at the chart, you will see daring attempts to break this level, each of which was thwarted and eloquently recorded by a steady green arrow.
Now imagine an alternative scenario – when the price boldly falls below the lower boundaries of the channel (colored in soft gray). This is where the down move begins until a safe haven is found in the respected $40-47 global support range (indicated by the bold red arrow). This moment may signal an opportunity, reminiscent of the echoes of July 2020, when a similar twist caused an incredible surge, pushing the price up to an incredible $413 per coin – a staggering 927% jump.
Anticipation fills the air as we wait for these unfolding narratives. Stay tuned. In a dynamic trading environment knowledge dominates and our pursuit of it ensures that we are always one step ahead.


